Network Security
Firewall GeoIP Threat Monitoring
Live world map of every blocked and allowed connection at my network edge, built from five open-source services.
- Pipeline
- 5 services
- View
- Live world map
- Source
- Firewall syslog
Problem
A firewall generates thousands of log lines that nobody reads. The data to answer “who is knocking on my network, from where, and how often” is all there, but raw syslog is unusable for situational awareness. I wanted my OPNsense edge to show me its activity the way a SOC display would: geographically, in real time, at a glance.
Approach
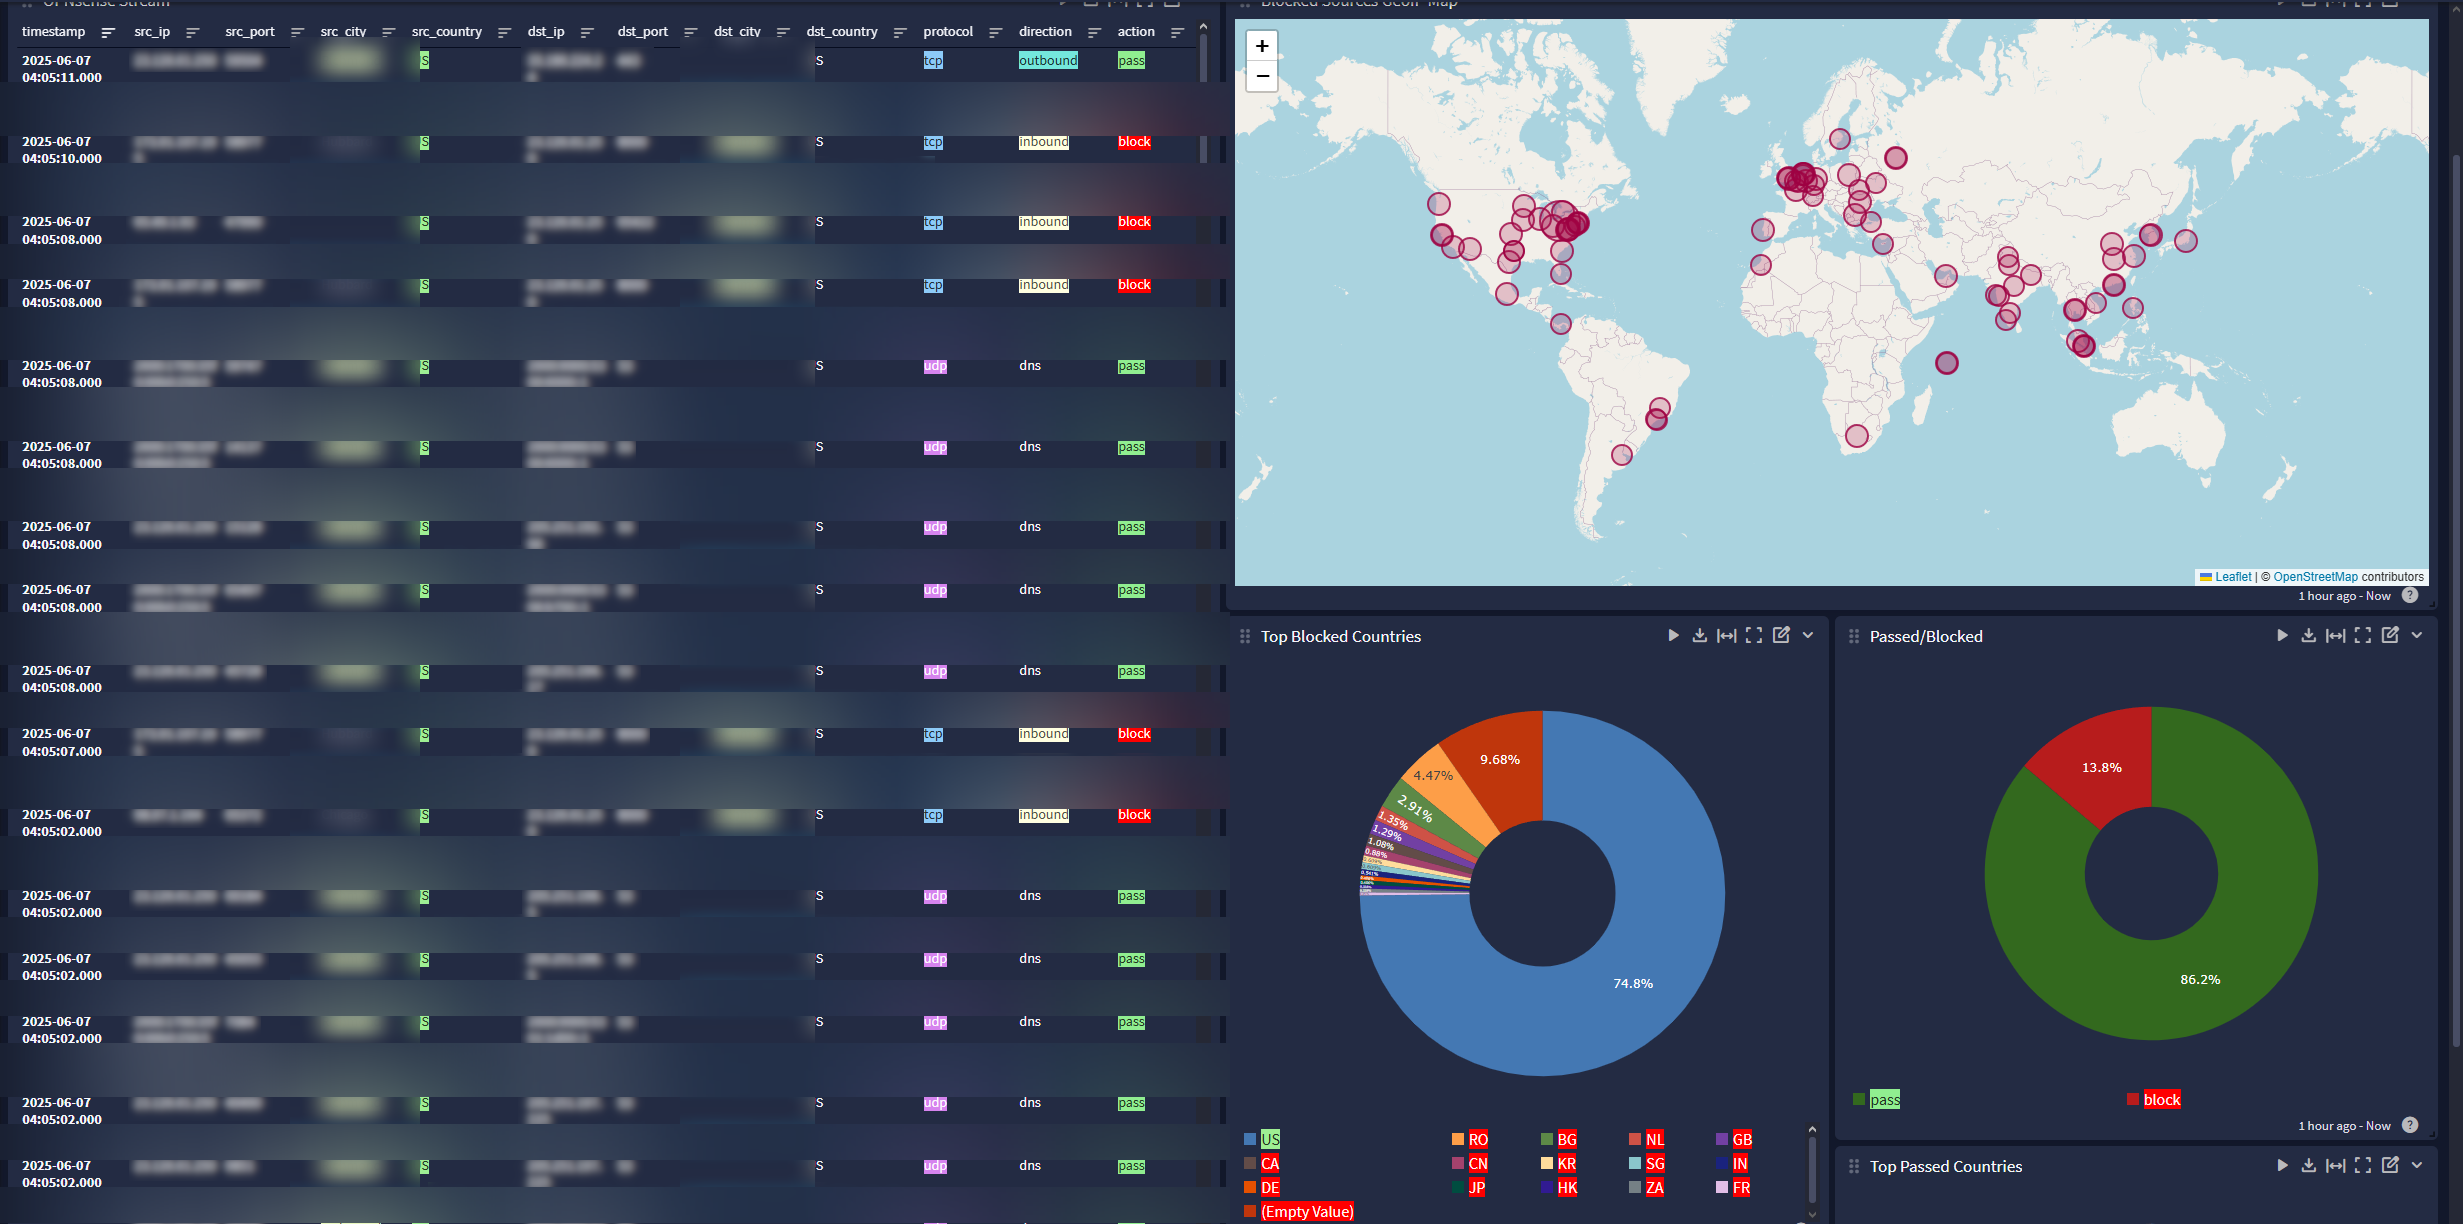
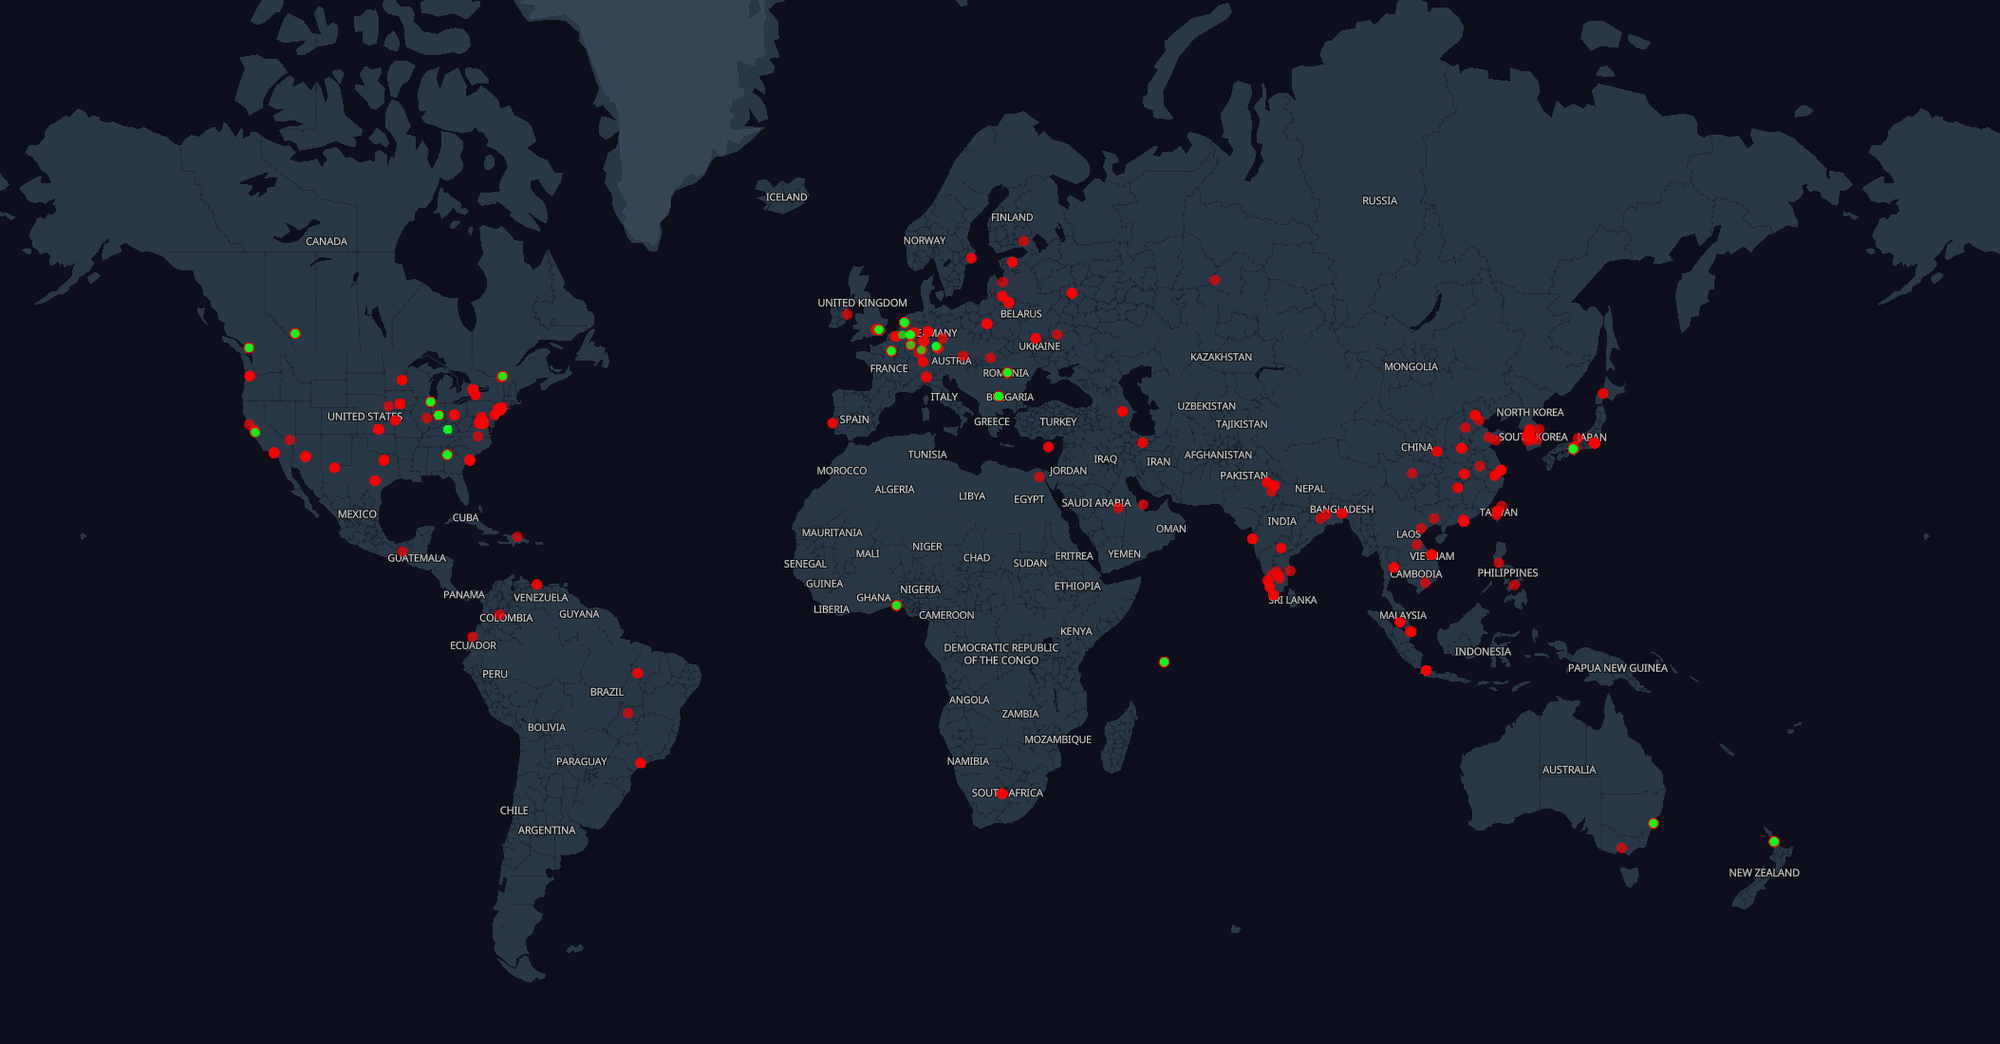
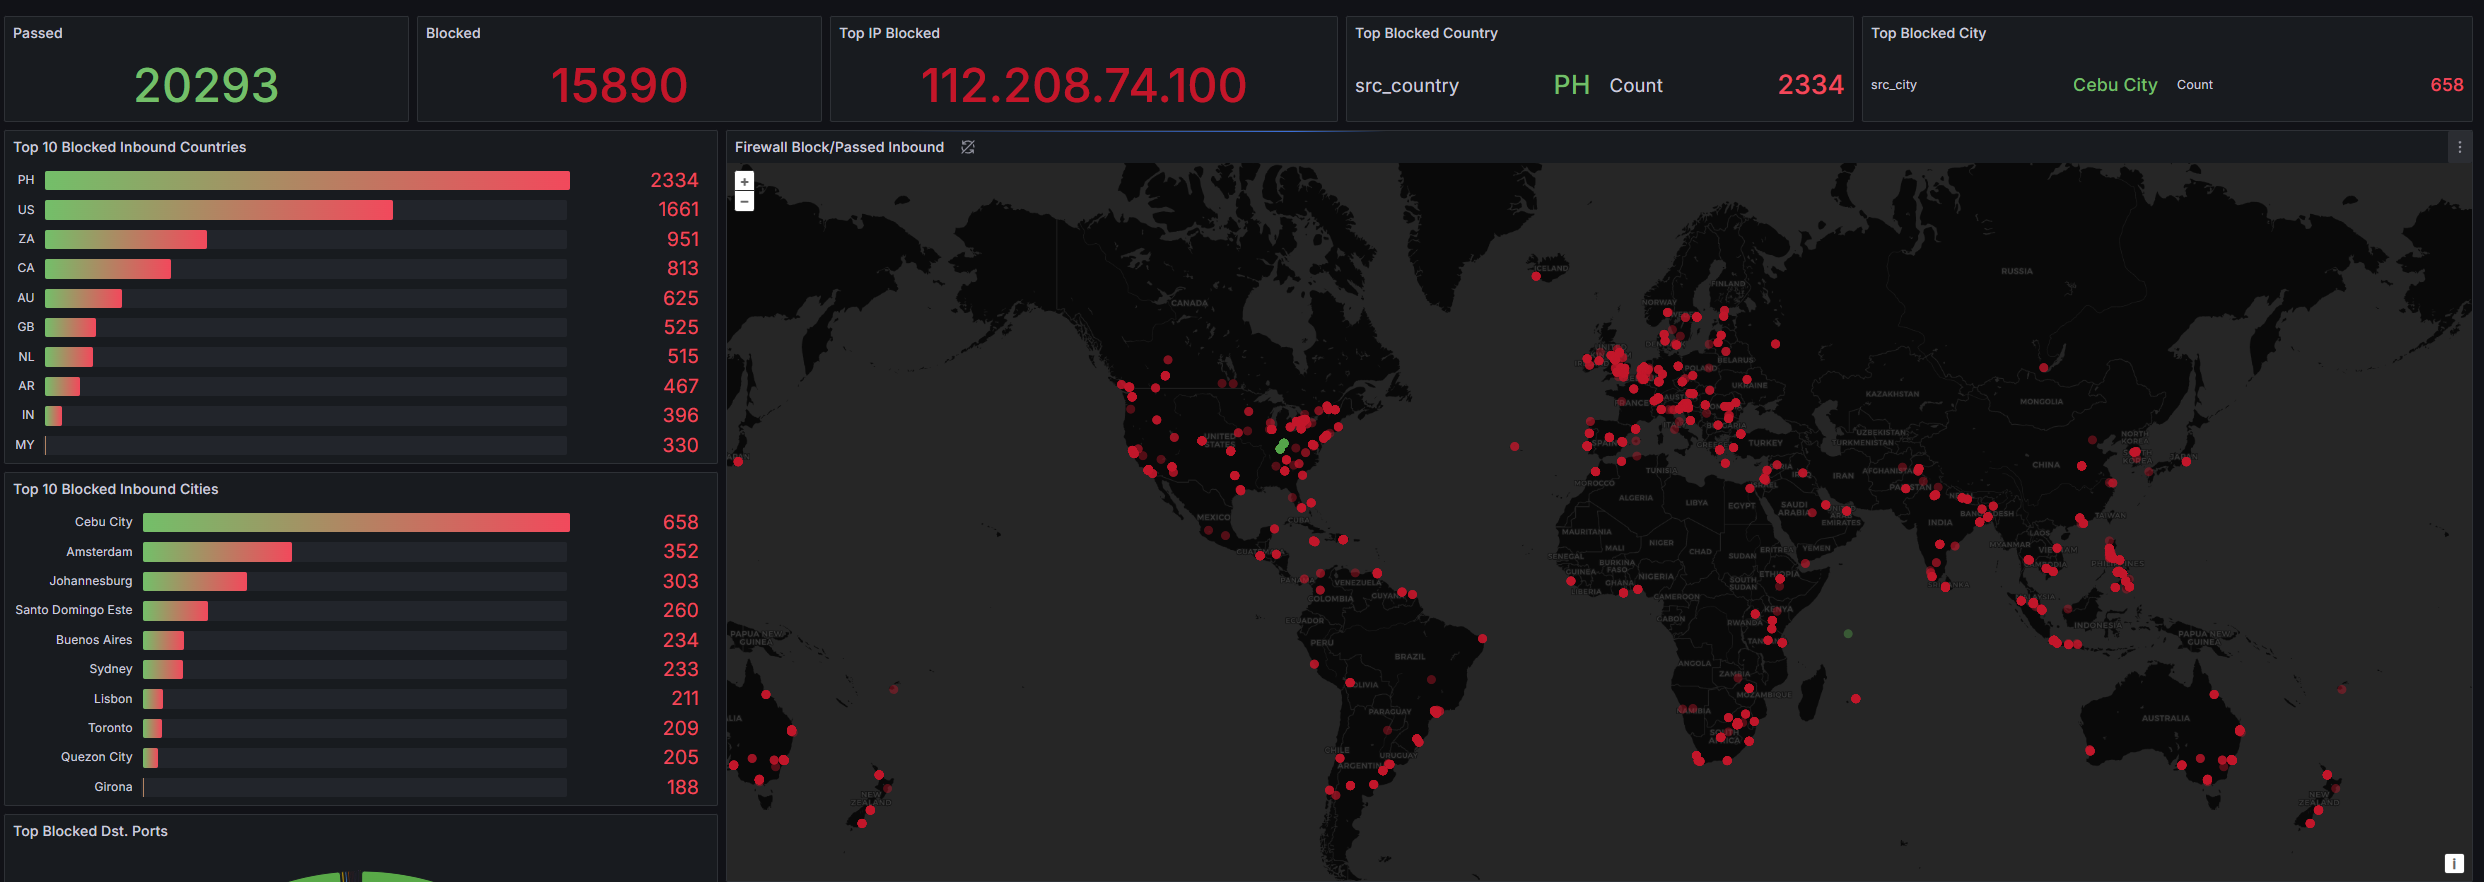
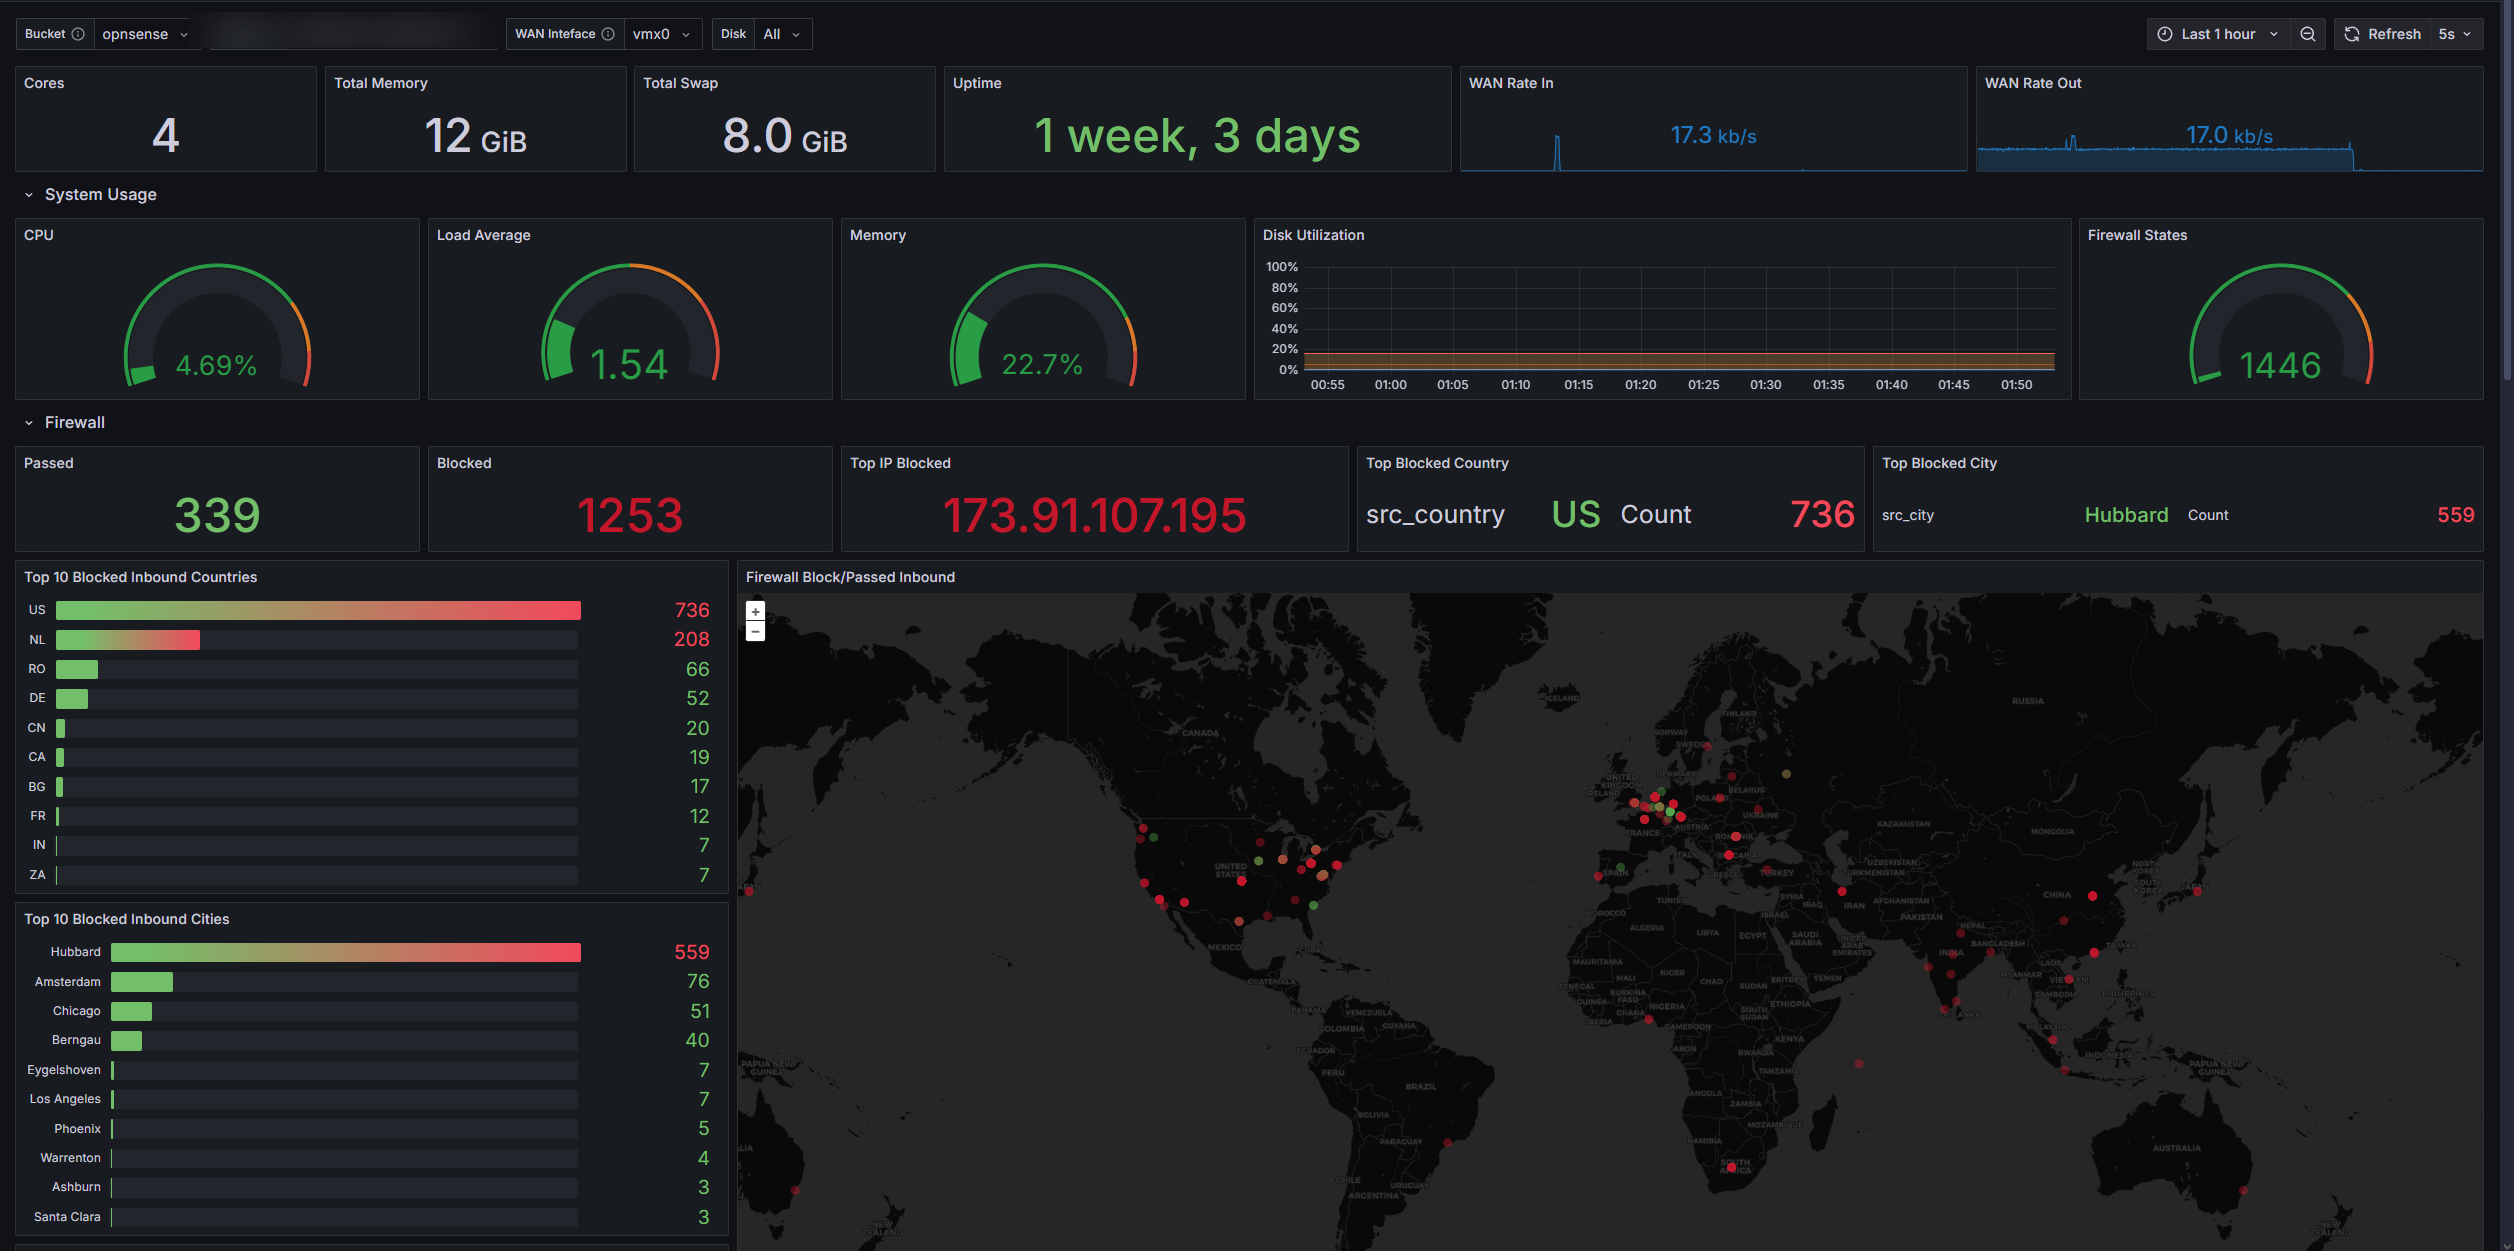
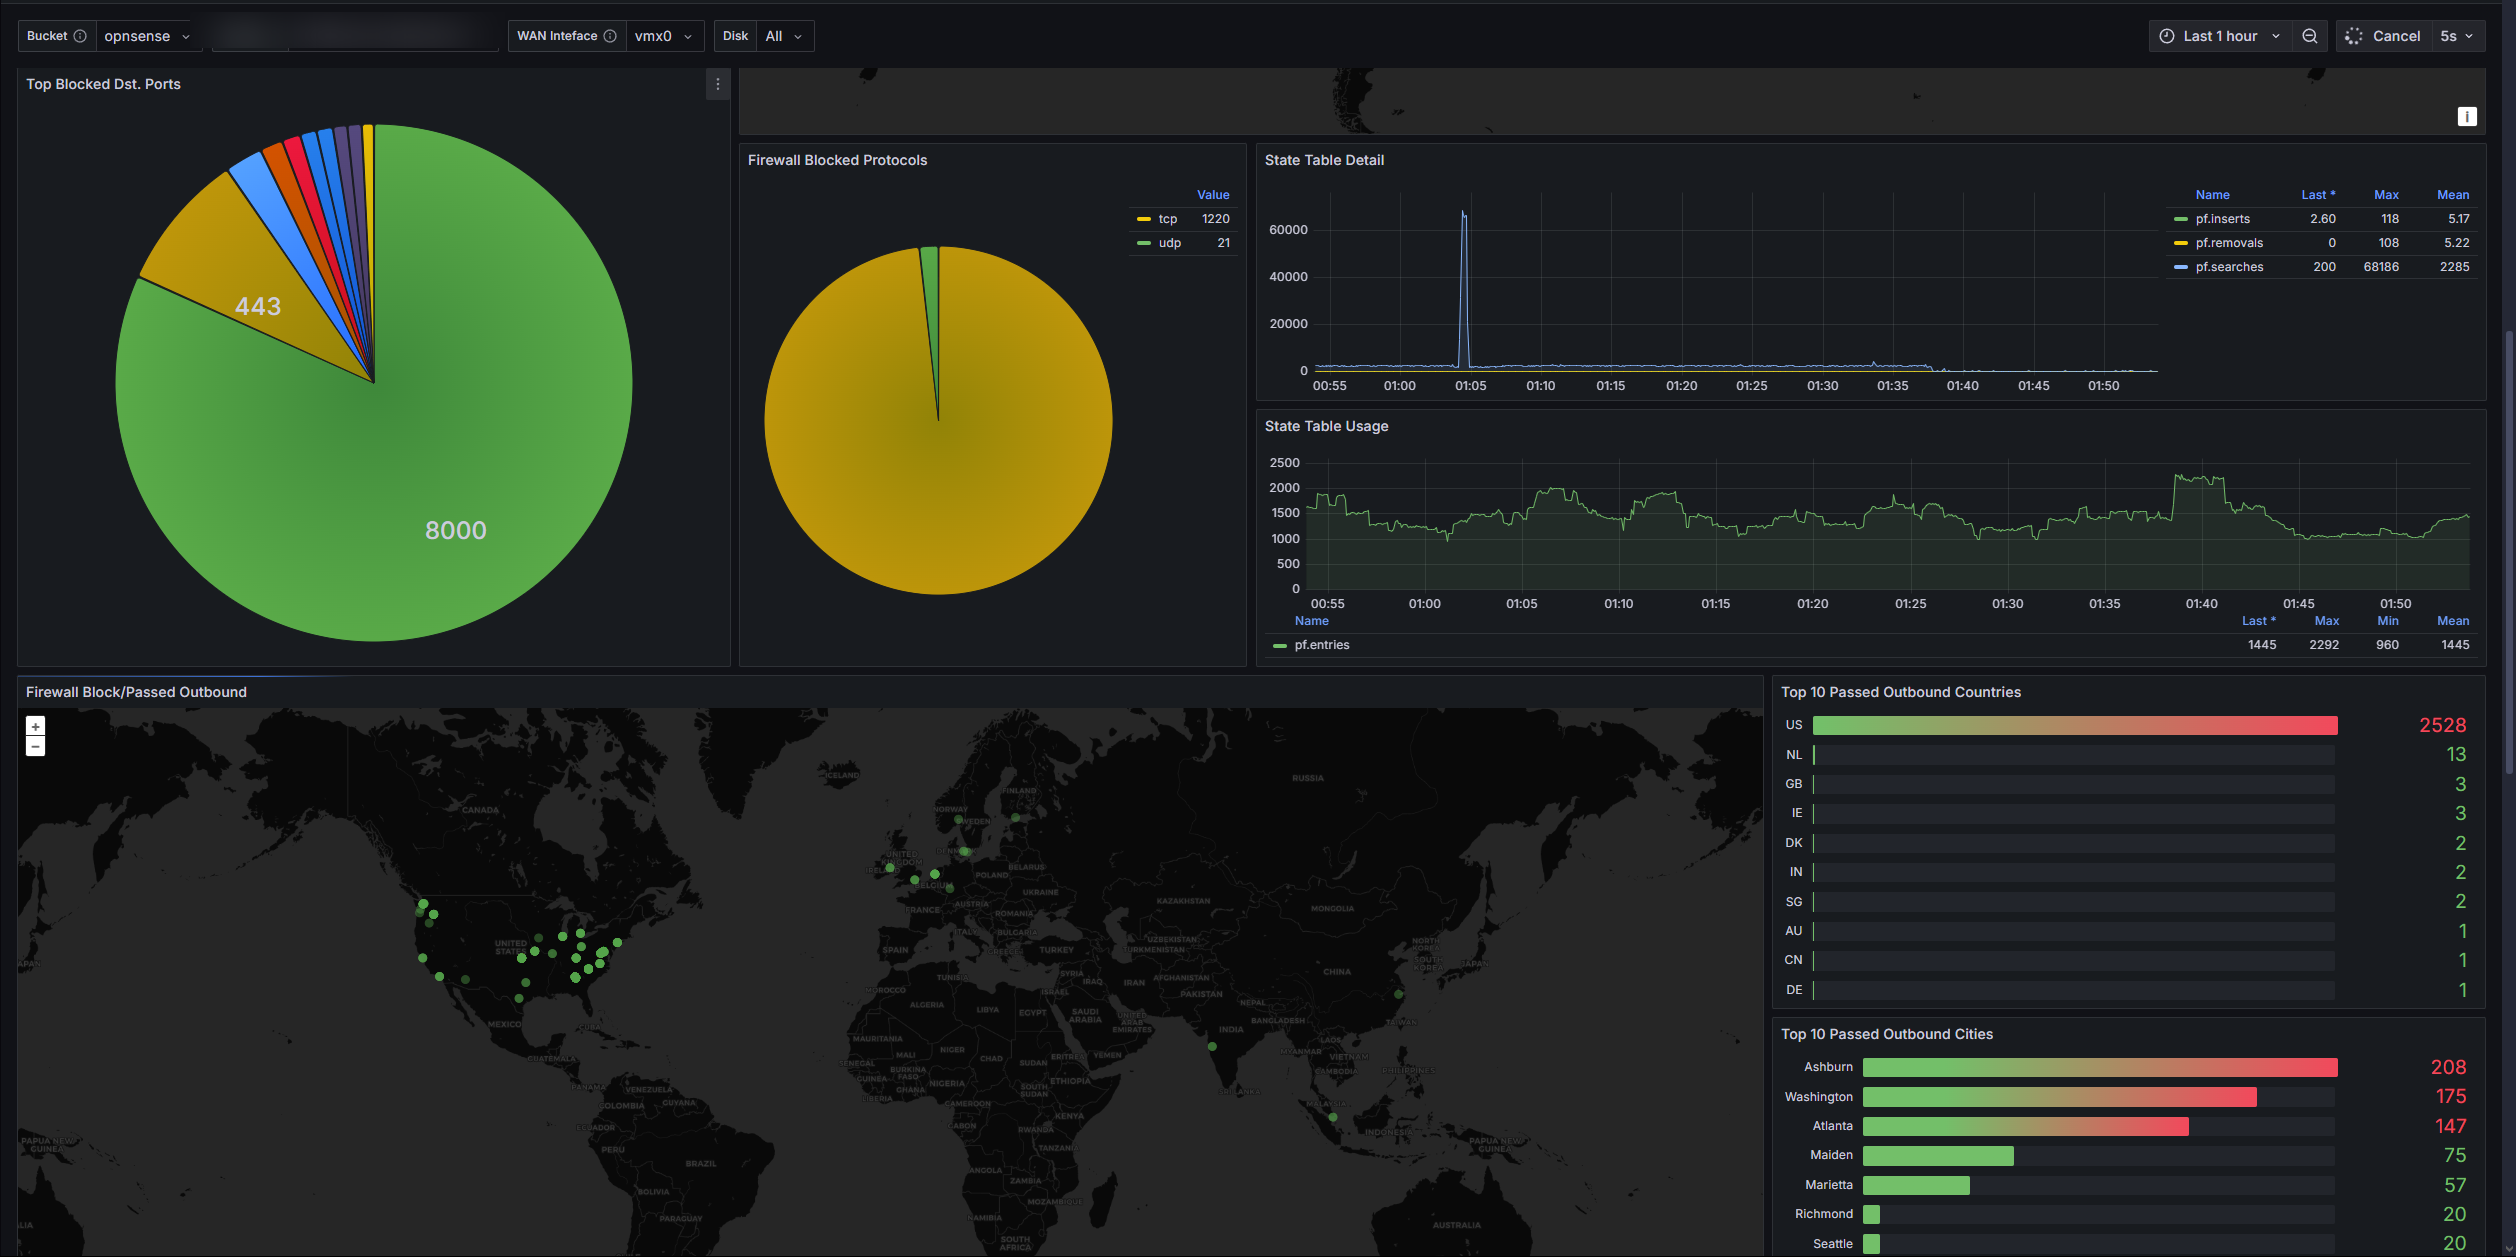
I built a five-stage pipeline, every piece of it open source and self-hosted. The firewall forwards its logs via syslog to Graylog, where custom extractors parse each event into structured fields: source and destination IP, action, protocol. Graylog pipeline rules then enrich every event with geographic coordinates from MaxMind’s GeoIP database. The enriched stream lands in OpenSearch for storage and fast querying, and Grafana sits on top, rendering every connection attempt as a point on an interactive world map: red for blocked, green for allowed. InfluxDB feeds the same dashboards with bandwidth and performance metrics, so traffic volume and threat activity live on one screen.
The screenshots here are from the OPNsense generation of my edge, which indexed several million firewall events before I migrated the gateway. Building it on syslog rather than a vendor integration is what made that migration survivable: the ingest, enrichment, and visualization layers never knew what device was upstream, so replacing the firewall is a matter of re-pointing a log target, not rebuilding a pipeline.
Result
A glance at the dashboard shows the geographic shape of everything hitting my edge: scanning campaigns lighting up from specific regions, the steady background noise of the internet, and the traffic I actually invited. It changed how I manage firewall rules, from reactive to informed, and it demonstrates the full logging stack in miniature: collection, parsing, enrichment, indexing, and visualization, each layer a tool used the way enterprises use it. The stack is still standing and still ingesting: the same Graylog and OpenSearch cluster now carries application logs from other services in the lab.